
Source: Fast Company
By Cliff Kuang
Every year, wars and natural disasters drive refugees from their homes, scattering them in far-flung corners of the globe. But where, exactly, do they go?
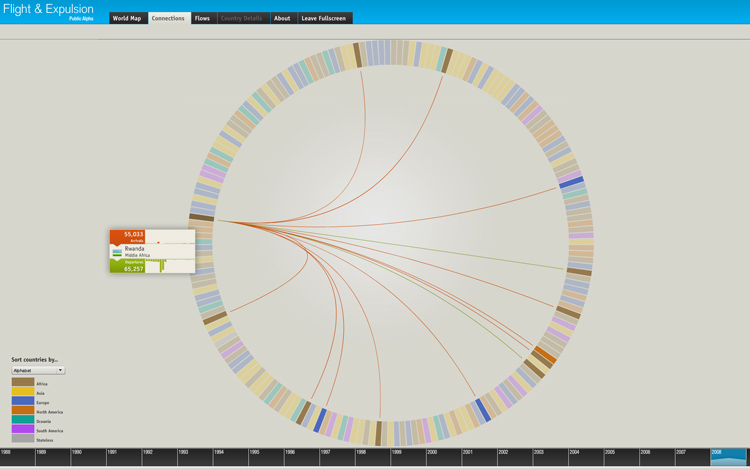
Flight and Expulsion, an interactive infographic out of the Germany's University of Applied Sciences, Potsdam brilliantly explores those mass migrations. What's truly remarkable is how many useful cuts at the data there are -- allowing you to see, for each of the last 20 years, where people fled from, where they went, and what countries have given the most succor in total.
Drawn from the UN's annual refugee report, you can view the data three separate ways. This one shows the countries that people left, and the countries they found refuge in:
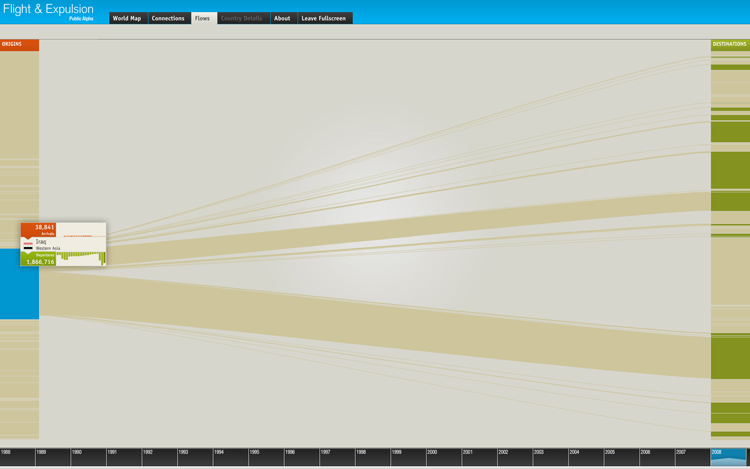
This one, based on a similar idea, is probably the most elegant and information-rich of the lot. In addition to showing where people came from and went to, it also shows the relative numbers. Thus, you can see in one glance which conflicts are creating the most refugees and which countries are offering the most shelter:
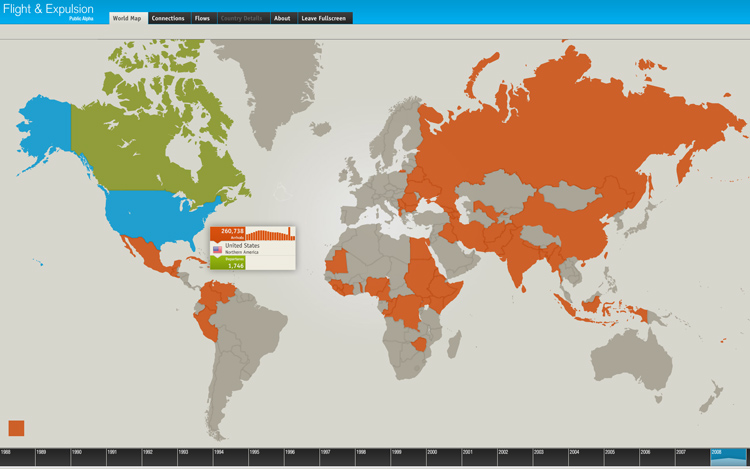
And finally, there's a map that shows how many refugees each country has created or aided:
For every single map, you can select any one of the last 20 years, to see how migration flows changed in response to world events.
Brilliant stuff. Definitely check out the interactive version.
Saturday, 9 October 2010
Great infographic shows where global refugees flee to and from

♦ Add to del.icio.us ♦ DiggIt! ♦ Add to Reddit ♦ Stumble This ♦ Add to Google Bookmarks ♦ Add to Yahoo MyWeb ♦ Add to Technorati Faves ♦ Slashdot it ♦
Subscribe to:
Post Comments (Atom)

 by Brett Lock")

 RSS feed
 Join our page

0 comments:
Post a Comment